🖥 PC Client#
Download#
Microsoft Store Download: Microsoft Store Page
Independent exe version:IoT Power.exe(note Microsoft/360 kill soft false alarm, tinder no problem)
**Full platform command line data logger UI:IoTPower CLI Tool
dll/so Dynamic Runtime Library:Gitee iot-power dll/so
Win7 Users see this line below! Expand!!
win7 Users may need
(win10 The above drive-free, no need to manually install the driver)
IoT Power V1 CP2102 Drive:CP210x_Windows_Drivers
IoT Power Pro Drive:IoTPowerPro-Driver.7z
IoT Power CC Drive:IoTPower_CC_usb_driver.7z
.net framework 4.6.2:Installation Package
Command Line Data Logger
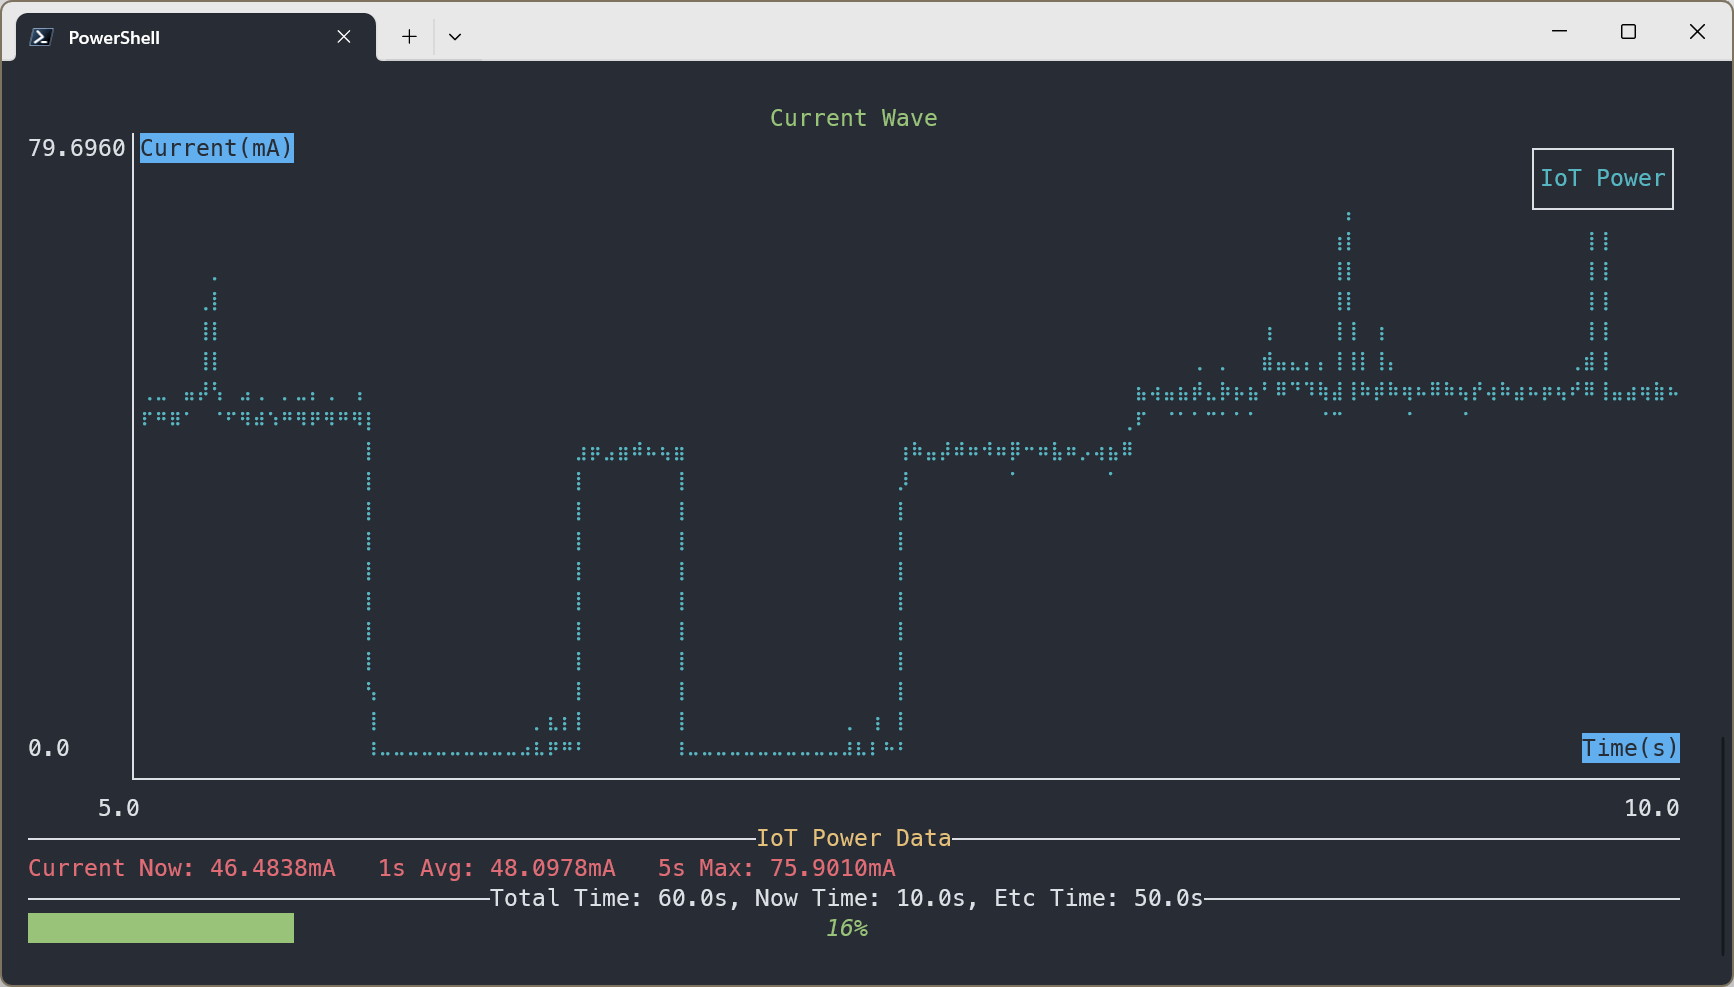
Download:IoTPower CLI Tool
Introduction to the client#
The following features are available on the client and may continue to increase:
View Current Waveform
Record historical data
Analyze data for a specified time period
Average current
average voltage
average power
Peak, minimum current
Peak, minimum voltage
Import and export captured data. You can export data independently.exe
Upgrading Firmware for Devices
Run the lua script to control the output and simulate the discharge curve of the battery and other equipment.
Note
This tutorial was written in version 2.0.7.11. If there are any new or changed functions not mentioned, please leave a message at the bottom of the page to remind you to update, thank you.
Software Interface#
The layout of the software homepage is shown in the following figure
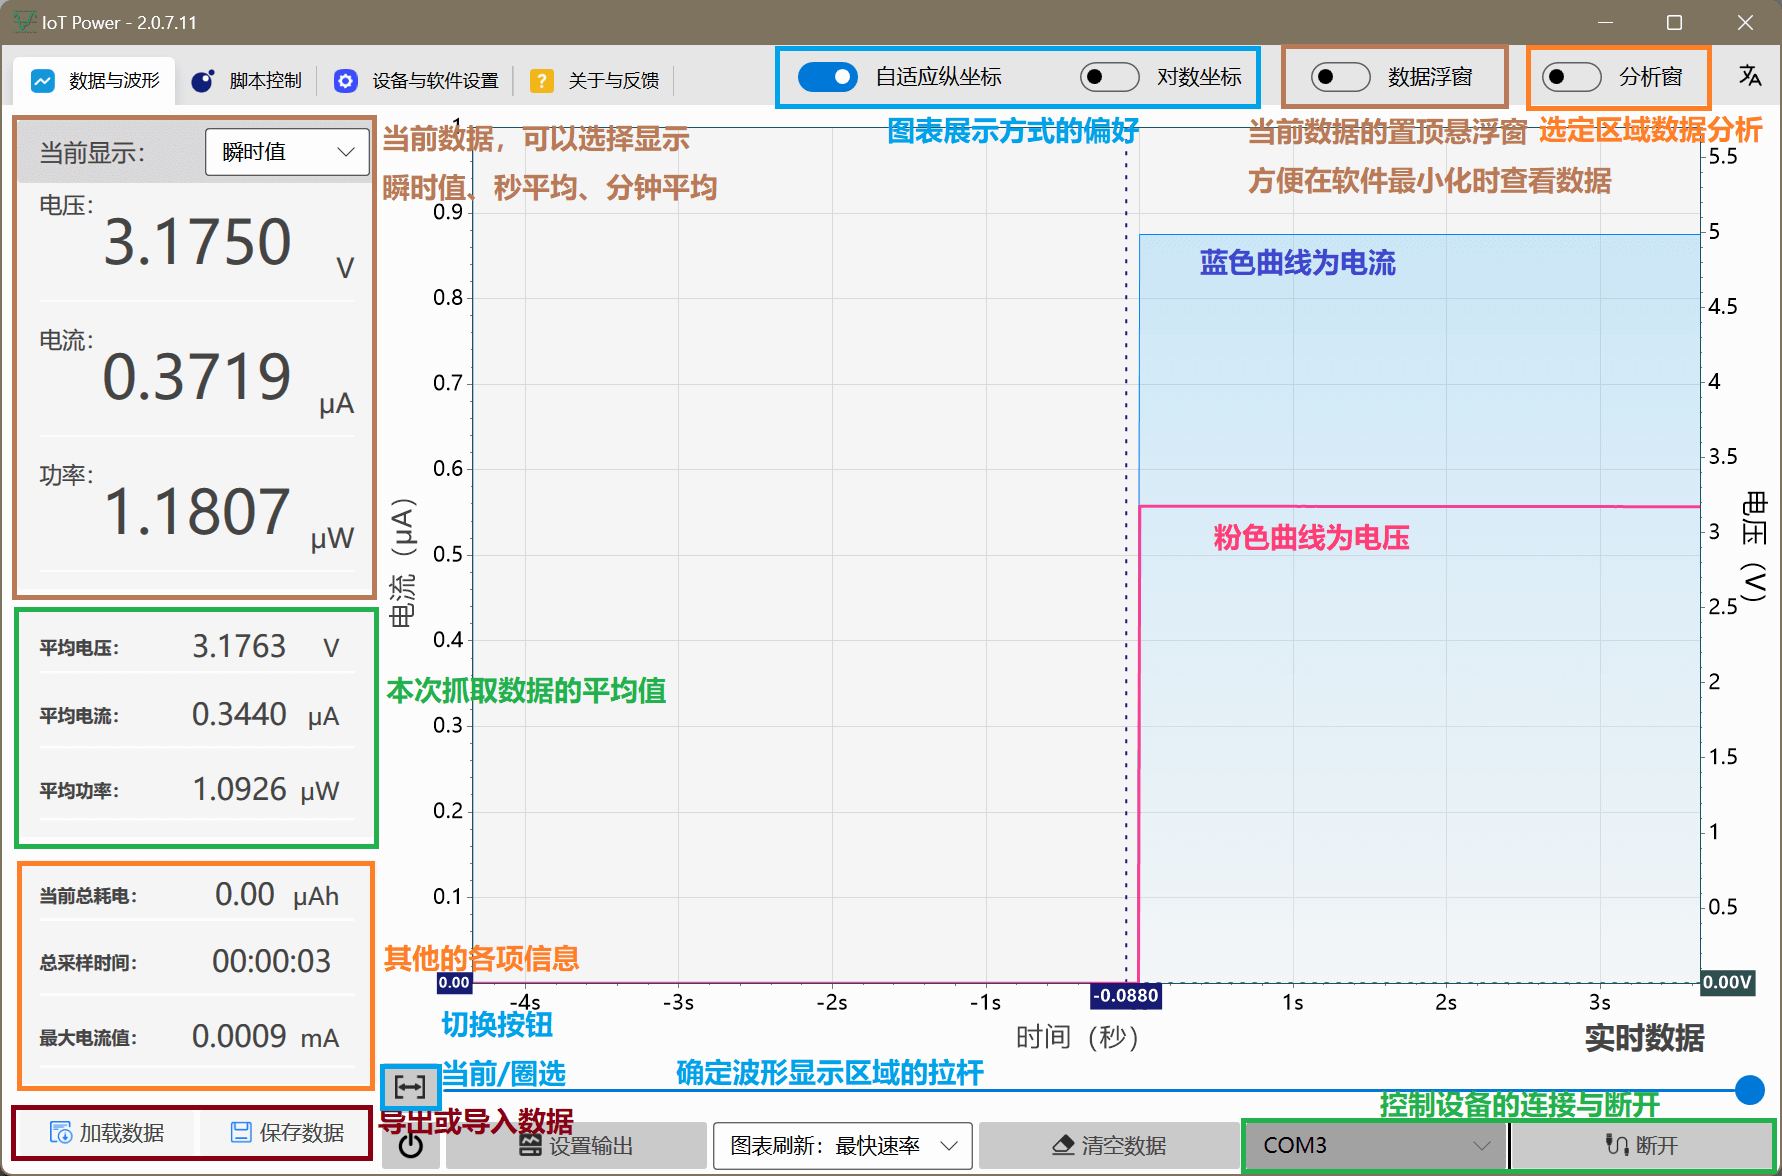
Current Display#
The value of this area is the current data after the device is connected, which can be switched to the moving average or instantaneous value.
The data floating window switch on the top of the software can open the floating window, and the displayed data is exactly the same as the data here. it is always displayed on the top, which is convenient to view real-time data after minimizing the software.
If it is in the instantaneous value gear, it may be inconsistent with the display at the device end. This is a normal phenomenon, because the refresh time point cannot be completely consistent.
Average data#
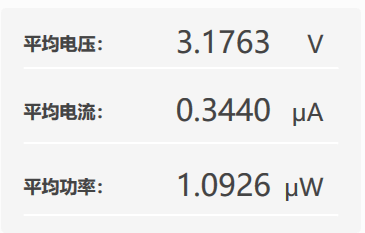
The data here is the average value of all data since this device connection. Clear and reset
Other data#
The data here is the relevant cumulative data of all data since the current device connection, cleared and reset
Click the value area of Power Consumption Data to switch between ‘Wh’ and ‘Ah’ values.
Chart Area#
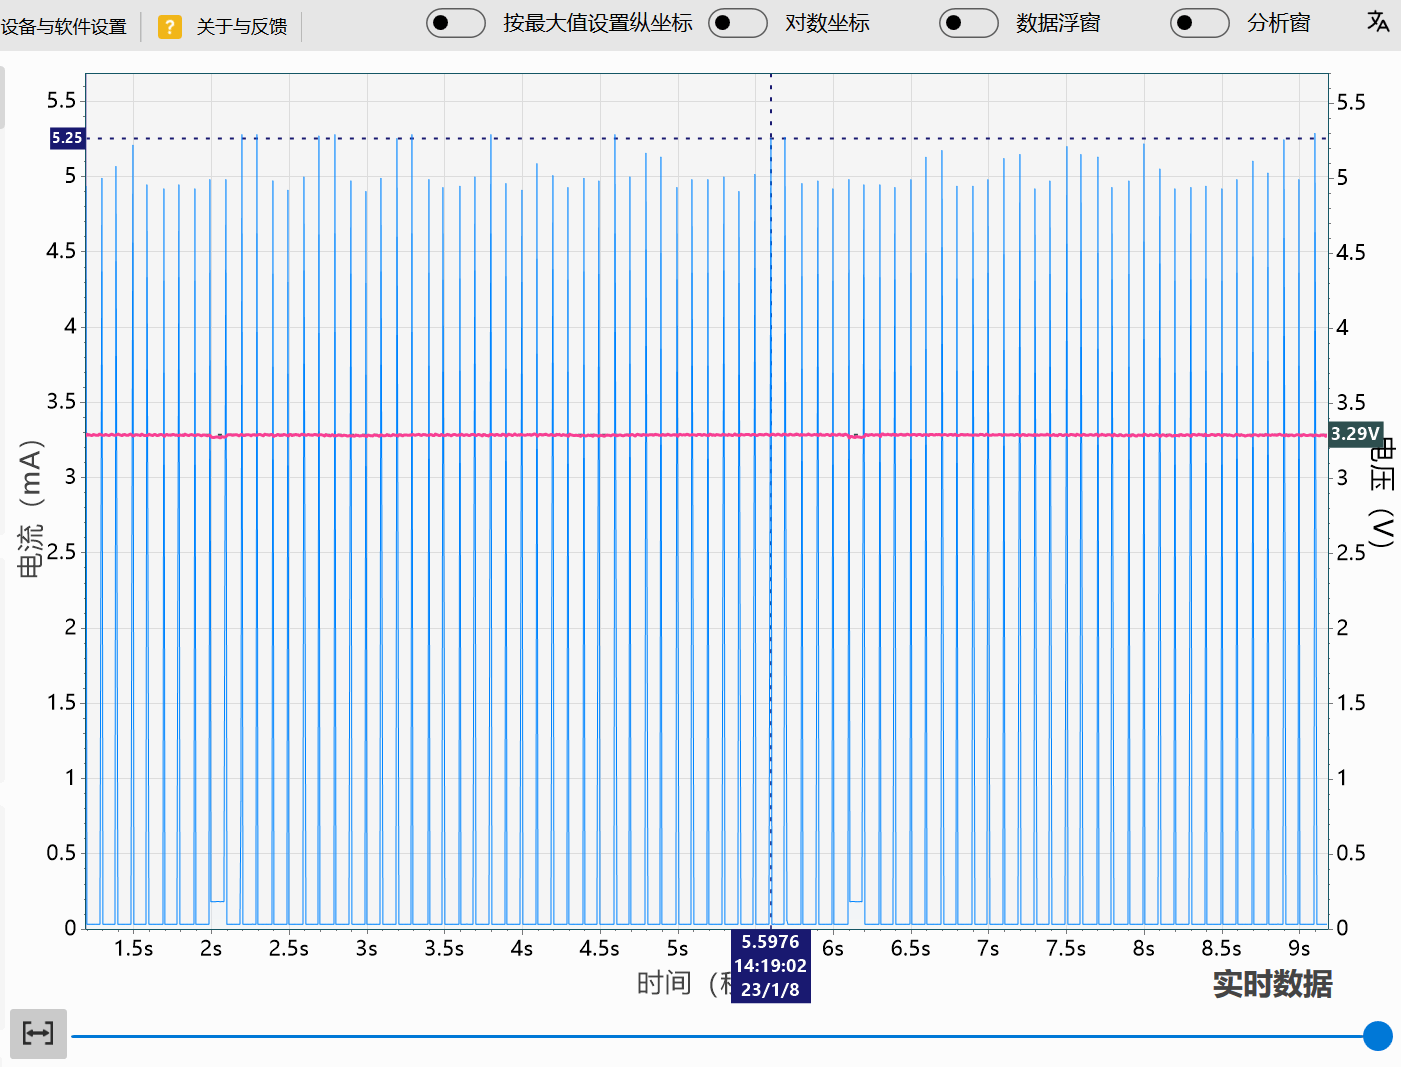
This area is the chart display area where you can preview the waveform
Adjust the display mode#
Adaptive coordinates: dynamically determine the vertical coordinate range according to the maximum value of the current display area
Set vertical coordinate by maximum value: set the vertical coordinate range by the maximum value of the captured data.
Logarithmic coordinate: When the absolute value of current data is greatly different, this function can be enabled, and the value of the ordinate will be displayed in multiples of 10
Switch data display mode#
Press this button to switch between Real-time data/historical dataandSelect an area. The two modes are described below.
Real-time data/historical data (no scaling)#
When the mouse is in the chart or on the drag axis, you can use the mouse wheel to adjust the time position of the waveform
You can also drag the lower joystick to control the time position of the currently displayed waveform
Select an Area (Enables Zoom)#
Use the left mouse button to drag **, you can select to view the data of a region, and enter the select regional data mode
When in Pick Area Data mode, you can use the mouse wheel to adjust the time position of the waveform
You can also hold down the CTRL key and scroll the mouse wheel to zoom in or out of the currently displayed area
The lower lever can also be used to control the range of the selection display.
Mouse drag the middle: you can adjust the time position of the waveform
Drag the left or right vertical line with the mouse: you can adjust the start or end time point of waveform display
Double-click the middle of the mouse: you can directly switch to view global data
Analyze data#
When in any mode, you can right-click and drag to select a time period to analyze the data in it.
When an area is selected, the Analysis Window will pop up to display the results of the analysis
Control device output#
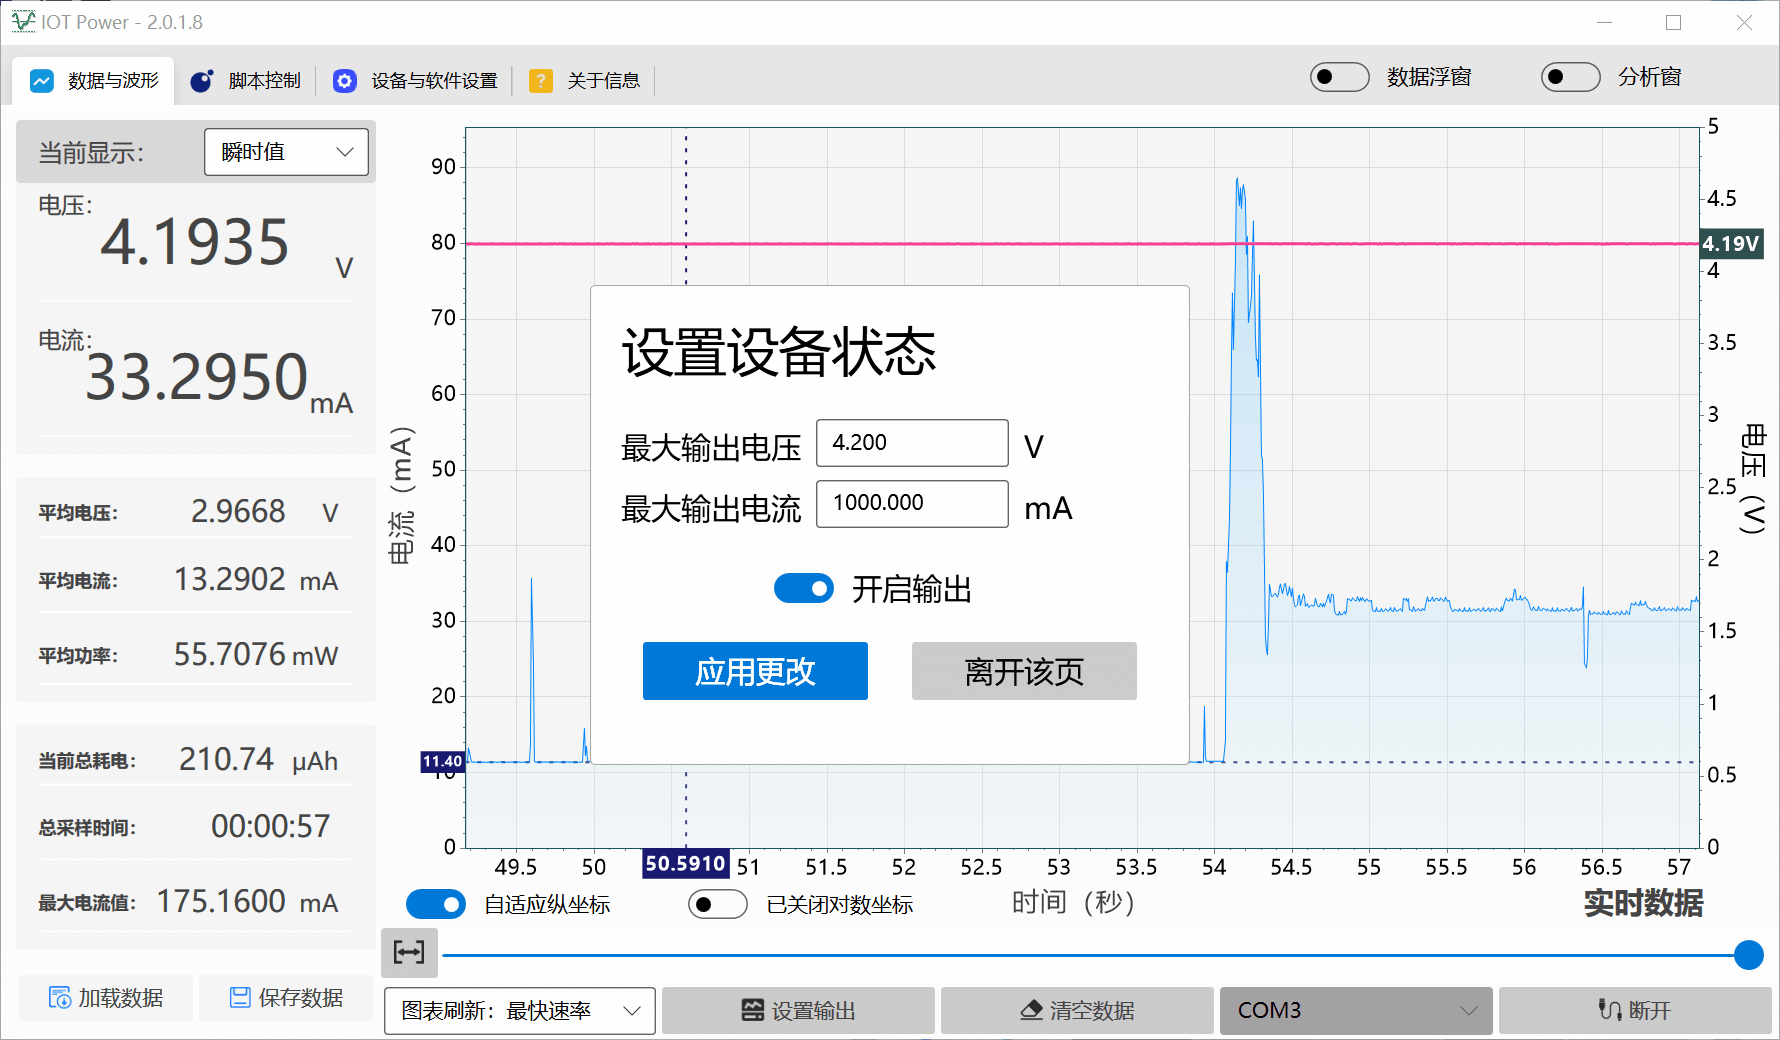
Control the output and off state of the device through the
power symbolbuttonSet the output voltage and current of the device via the
device outputbutton
Note
This function is only applicable to Power Products and products with PPS decoy function
Importing and Exporting Data#
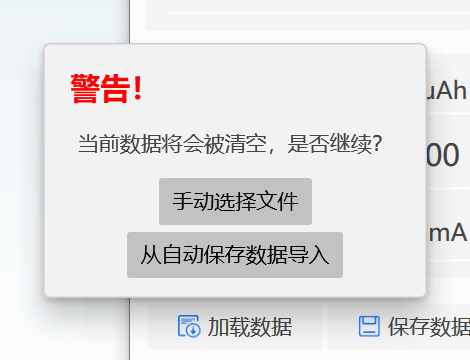
Import Data#
Manually select files to import
.iotplfiles for IoT PowerImport automatically saved file indicates to import from automatically saved file. Autosave function usually appears when closing and re-grabbing
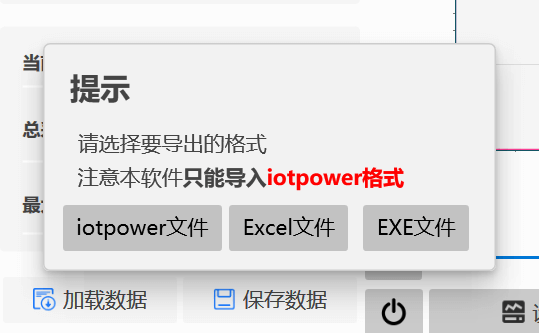
Export data#
Data can be freely exported as .iotpl file,.csv table file,.exe self-executing file
The difference is that the . csv table file is used by the user to analyze the original data and cannot be re-imported.
The .iotpl file can be imported into the software again, and the.exe self-executing file can also be exported as a.iotpl file for import.
Script function#
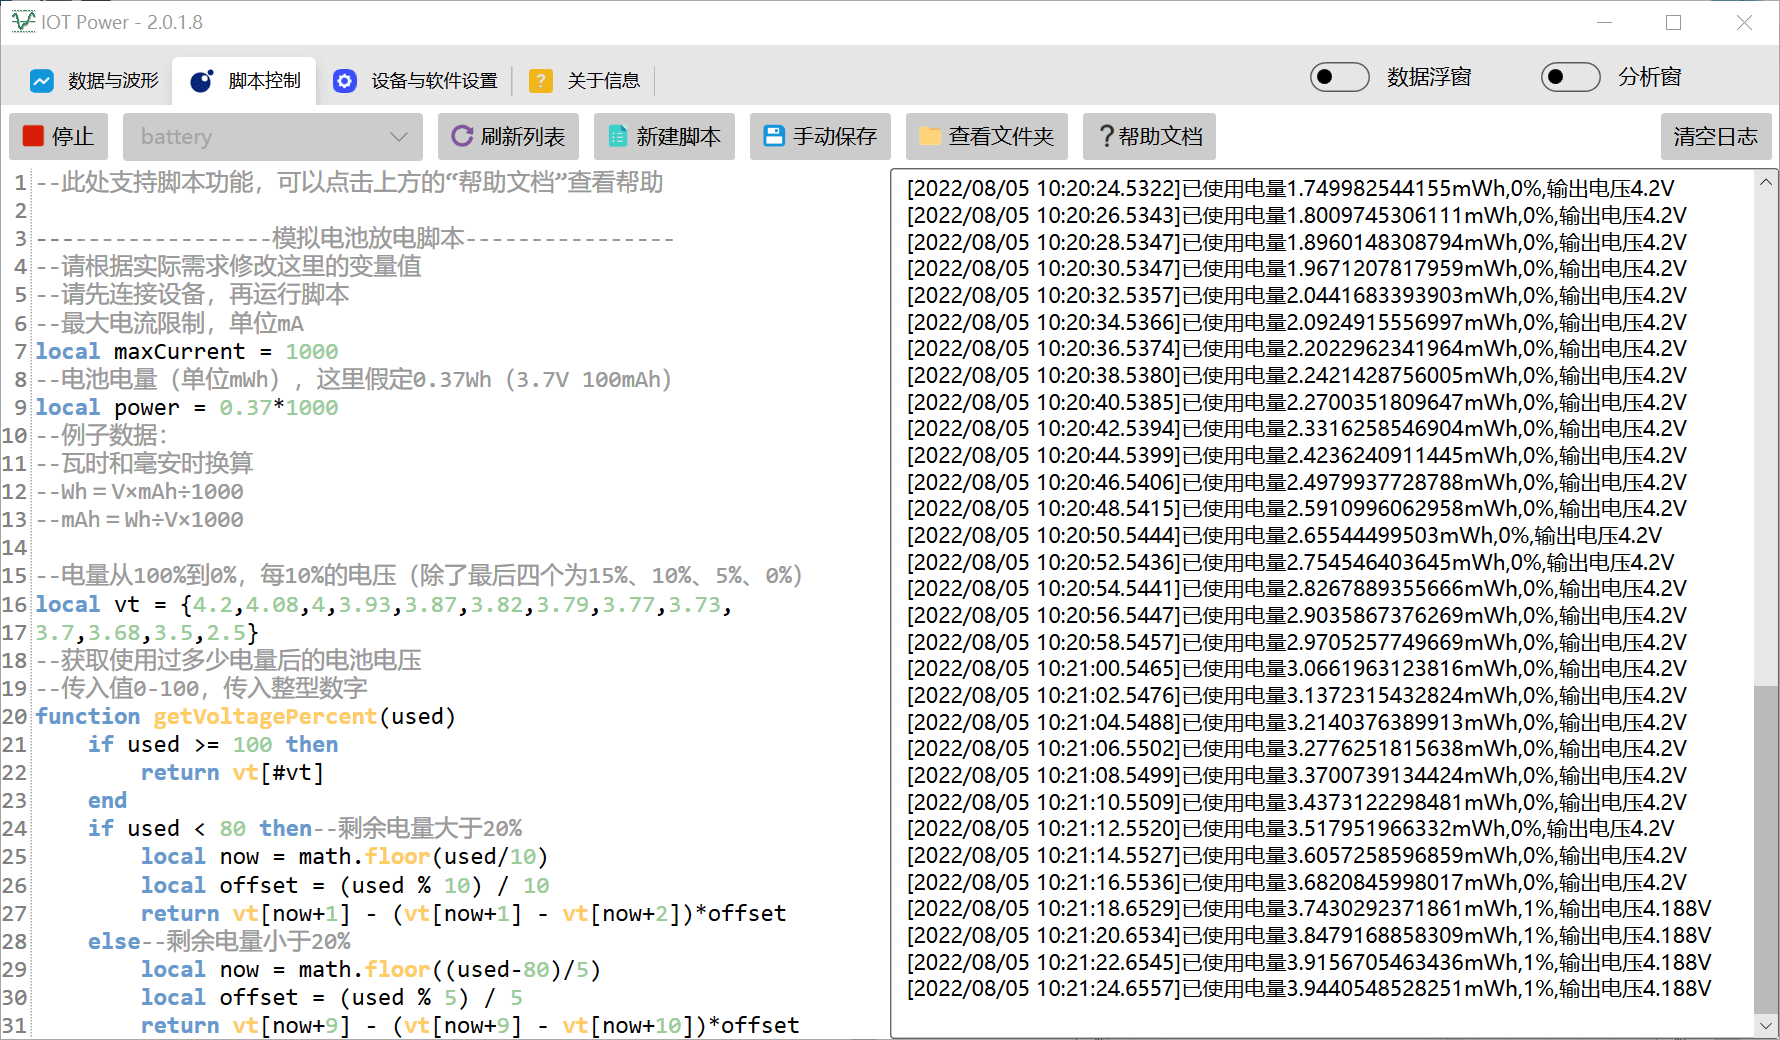
This function enables automatic control of output voltage and current
The script uses the Lua language and adapts to LuaTask framework (tutorial )
For specific interface documents, please refer to the data of this warehouse.
Force firmware upgrade#
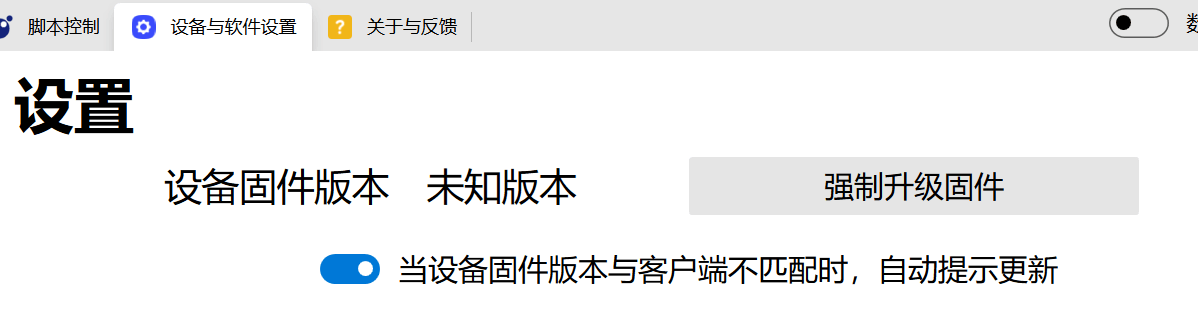
Typically, the device firmware will automatically prompt for an upgrade. However, sometimes when the device is interrupted during the upgrade or the firmware is damaged due to other reasons, the firmware can be brushed manually.
Click the
Force Firmware Upgradebutton to force the firmware of the client. Note: If the equipment has upgrade mode, please enter the upgrade mode before brushing.Right-click the “Force Firmware Upgrade” button to force the firmware file manually selected by the user to test the function and verify the BUG repair.
Data caching method#
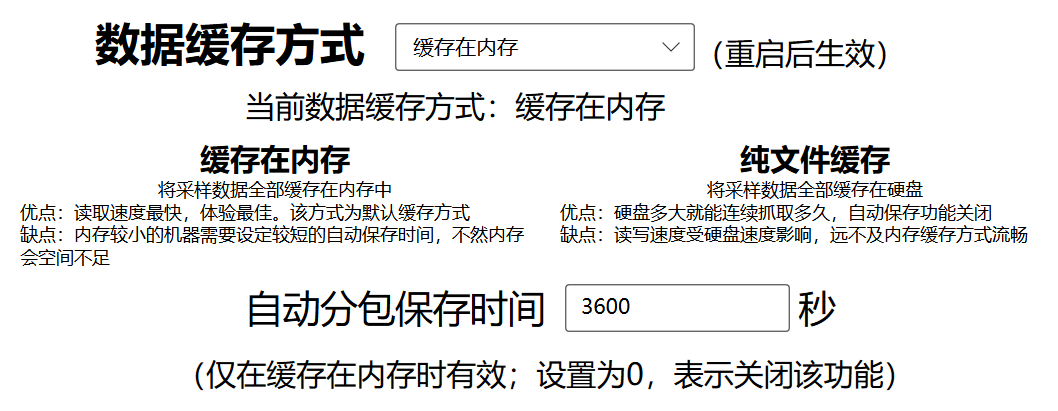
Because the device sampling rate is very high, so the amount of data is very large, stored in the memory may lead to insufficient computer memory
Therefore, the software provides an automatic save function. When the time is reached, the data is automatically saved to a file to prevent excessive memory usage.
Of course, in order to store some users abnormal level of massive data (such as continuous capture more than ten hours), the software also provides the use of hard disk cache data function
In this mode, the fluency of the part is sacrificed in exchange for a greatly reduced memory footprint, and automatic saving is not triggered to ensure data continuity